Studio RTP Spread & Catalog Span (2016-2018)
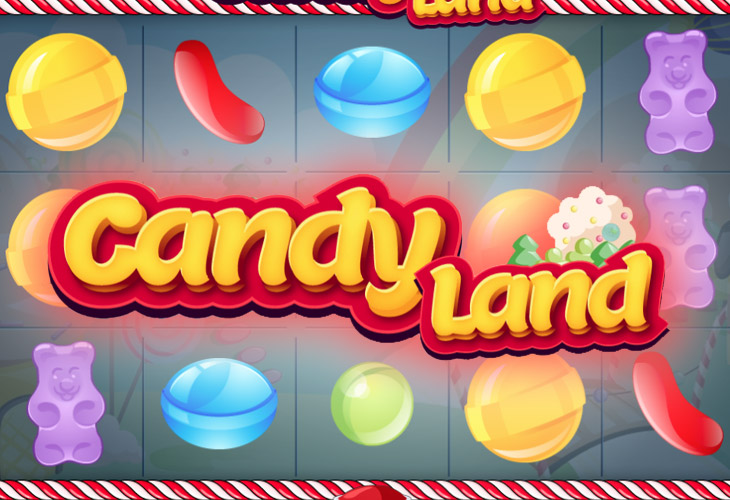
Across 7 cataloged titles released between 2016 and 2018, Capecod Gaming averages 95.29% RTP (median 95.04%) with a 2.55-percentage-point spread between its lowest-RTP title (Shangri La at 94.25%) and its highest-RTP release (Candy Land (96.8%)). 1 titles (14% of catalog) carry verified studio-hosted HTML5 demos.
Volatility Profile, Grids & Dominant Themes
The dominant volatility class in Capecod Gaming's portfolio is Medium (7 / 100%), peaking with Candy Land (1,000x). Most releases build around 5x3 (7) reel configurations across genres including Animals, Foodie, Treasure, Magic, Adventure, History, Classic.
Catalog Telemetry & Corporate Profile: Capecod Gaming
| Catalog RTP (Min / Median / Max) | 94.25% / 95.04% / 96.8% |
| Highest RTP Title | Candy Land (96.8%) |
| Highest Max Win | Candy Land (1,000x) |
| Primary Genres | Animals · Foodie · Treasure, Magic, Adventure · History · Classic |
Medium: 7
Capecod Gaming Catalog Slots (7)

| Slot Title | Year & Grid | RTP | Max Win | Volatility | Inspect |
|---|---|---|---|---|---|
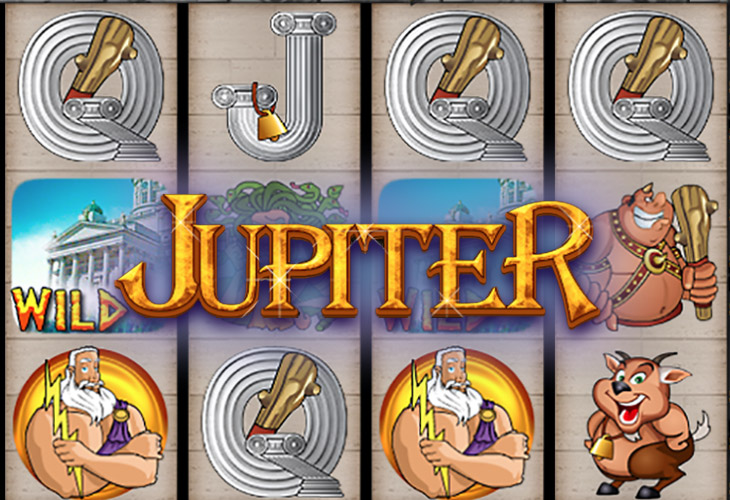
| Jupiter | 2016 · 5×3 | 94.6% | 1,000x | Medium | Demo → |
| Candy Land | 2017 · 5×3 | 96.8% | 1,000x | Medium | Specs → |
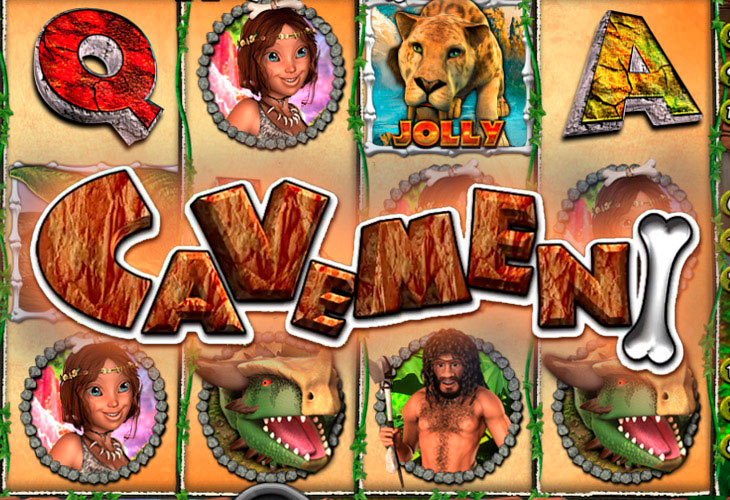
| Cavemen | 2017 · 5×3 | 96.48% | 1,000x | Medium | Specs → |
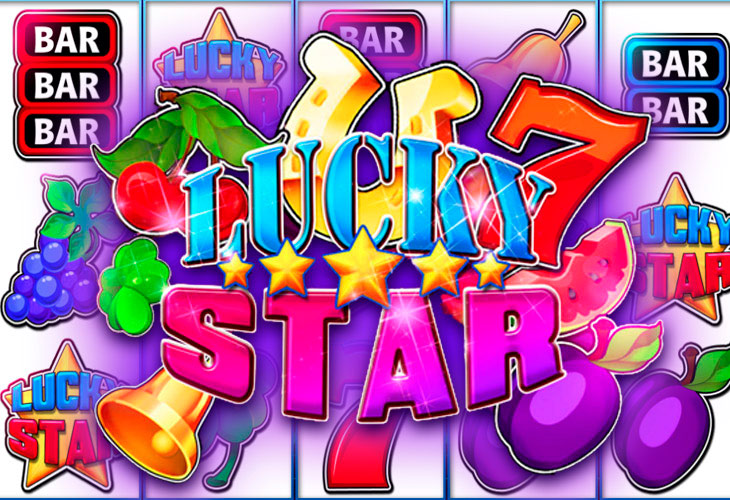
| Lucky Star | 2018 · 5×3 | 95.34% | - | Medium | Specs → |
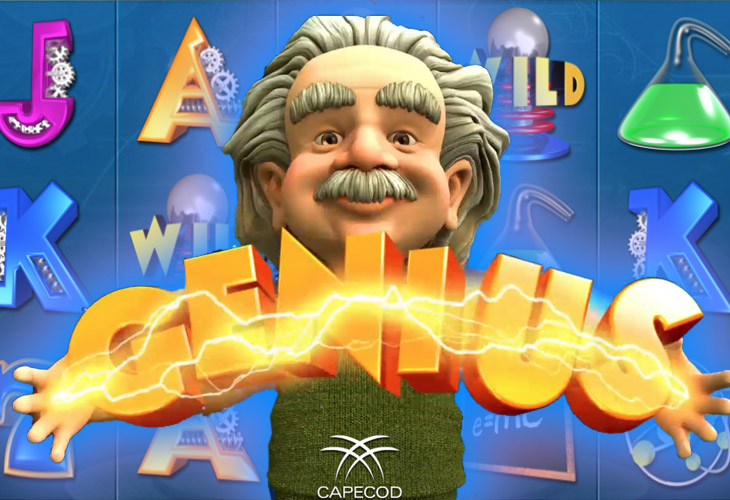
| Genius | 2017 · 5×3 | 95.04% | - | Medium | Specs → |
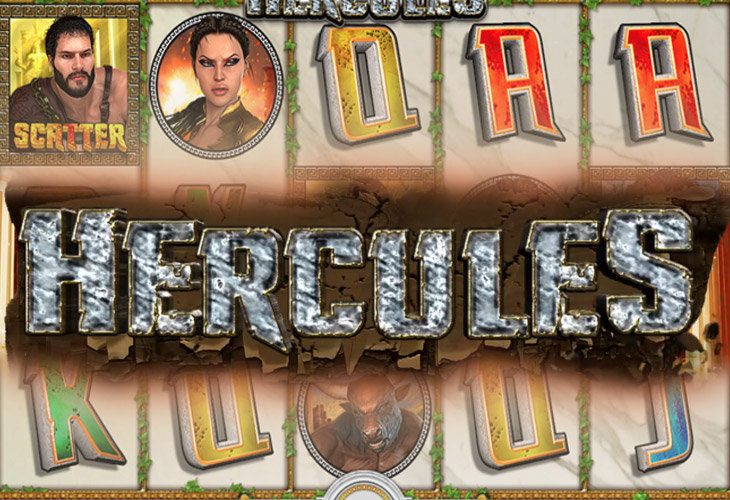
| Hercules | 2017 · 5×3 | 94.52% | 1,000x | Medium | Specs → |
| Shangri La | 2017 · 5×3 | 94.25% | 1,000x | Medium | Specs → |